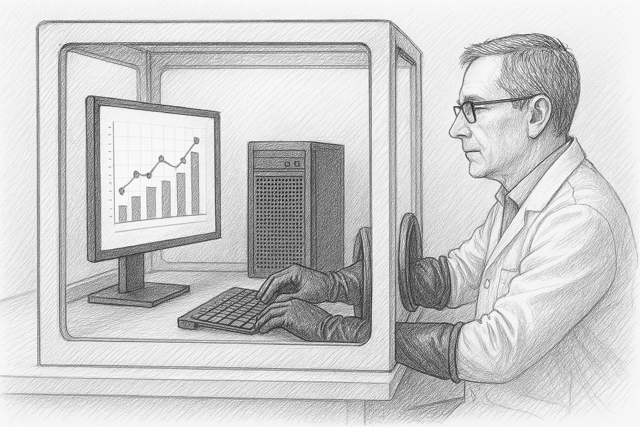
Observational Research in a Box

Welcome to the new way to access data – the data enclave. This is a private data platform, designed and controlled by the data provider, on which researchers must do all their work. In this post we share some initial impressions from our experience with three separate data enclaves, and how we are moving forward in this new world.
High-level observations
One project is based on the Medicare Virtual Research Data Center (VRDC) and the other two are based on commercial data enclaves. The good news is that R and Python are available in all three. The bad news is that SAS, Stata, and RStudio are not universally available. Also, one provider offers Databricks, one uses Snowflake, and the last uses Athena - three different underlying data platforms.
The data documentation has been better than the documentation from providers who allow us to have the data on our servers. However, no data provider provides sufficiently detailed information about each column (variable) in the data. We still have to do a lot of data discovery on the raw data before we can use it (e.g., identify missing data, discover unexpected values, determine relationships among the tables, etc.)
For privacy reasons, all three enclaves have tight restrictions on what can be taken off the system. This makes it challenging for the research team to review the data, and adds a delay since all output has to be reviewed.
Opportunity
As many know, we have our Jigsaw software which can generate the SQL to create analysis-ready datasets from data in a common data model. We can generate SQL in most dialects used by data platforms, so we can readily adapt our research process to data enclaves.
But before we can construct cohorts using Jigsaw, we need to organize the data into a data model. This process is time-consuming even on an on-premises system. To allow us to support multiple data platforms in a reasonable timeframe, we started building tools to shorten the process from 6-12 weeks to something more like 1-3 weeks.
Side note: We’d like to say we can do it in hours, but we are being realistic given the heterogeneity of data, the platform architectures, and the time it takes to process large amounts of data, even with powerful hardware. The good news is that once the code is written for a data source, it is substantially faster to process another instance of the same data.
Progress
We have just completed our first version of tools to facilitate the process. At a high level these tools do the following:
- Systematically explore every table and column in the raw data and characterize it in a Shiny app.
- This includes missing values, ranges, typical values, unusual values (which are often data errors), and the identifiers (keys) that are used to connect records in different tables.
- We also incorporate variable definitions from the data dictionary and show all relevant information in one interface.
-
Process the output of step 1 to create the mapping details required to move the raw data into the Generalized Data Model. This includes automating as much of the process as possible, and conducting logic checks to ensure that the mappings make sense.
- Use the mappings in step 2 to automatically generate an SQL script to implement the complete transformation process on the target data platform.
Importantly, these tools are being built in R as much as possible so they can be brought into any data enclave.
Why go through all of this?
In terms of working on data enclaves, the following are some of the key benefits of a set of flexible tools for data management and cohort building:
- The raw data stays on the data platform at all times, as required by data providers.
- The data provider’s schema remains private, as required by some data providers.
- The raw data is fully documented and can be compared to the reorganized data as part of a quality control process. This is important for research done for regulatory purposes, as well as being a good idea generally.
Implications
The most important implication is that we can use the same process for every project. We can organize the data into one data model. We can use one library of algorithms and one protocol builder for all research (Jigsaw). And because Jigsaw has its own data model for analysis-ready data, we can write efficient analysis code and standardize our analyses. In other words, we have the same path from start to finish regardless of whether the data is on premises or in a data enclave.
Another benefit is that all this infrastructure can be made open-source and available to anybody to use – competitors, data providers, commercial organizations, government researchers, etc. We are not ready for that yet, but that is where we are headed. If you want to know more, or to collaborate with us, don’t hesitate to contact us.
 by Outcomes Insights, Inc.